Grafana Dashboard for Prometheus official Python client with Flask App metrics
01-06-2019 11:00
| upd. 01-06-2019 20:50
|
|
in Blog
|
208 words
|
1 min to read
tags: prometheus grafana visualization metrics
tags: prometheus grafana visualization metrics
I’ve just open-sourced my Grafana dashboard. The dashboard designed for a Flask web application that exposes metrics with my flask_prometheus_metrics Flask extension.
Dashboard aimed at the apps deployed with Kubernetes, although it can be easily tweaked to be infrastructure-agnostic.
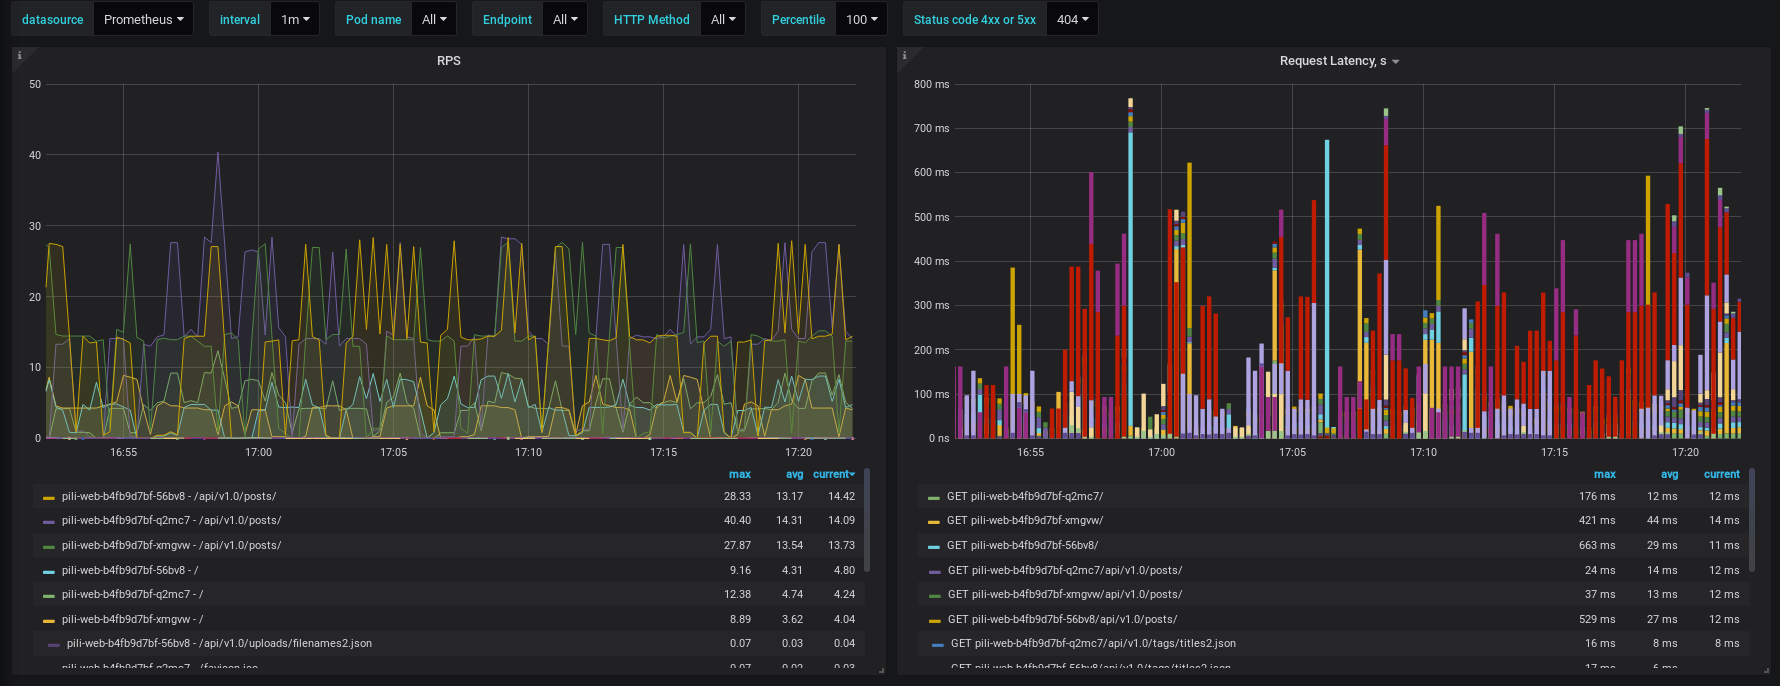
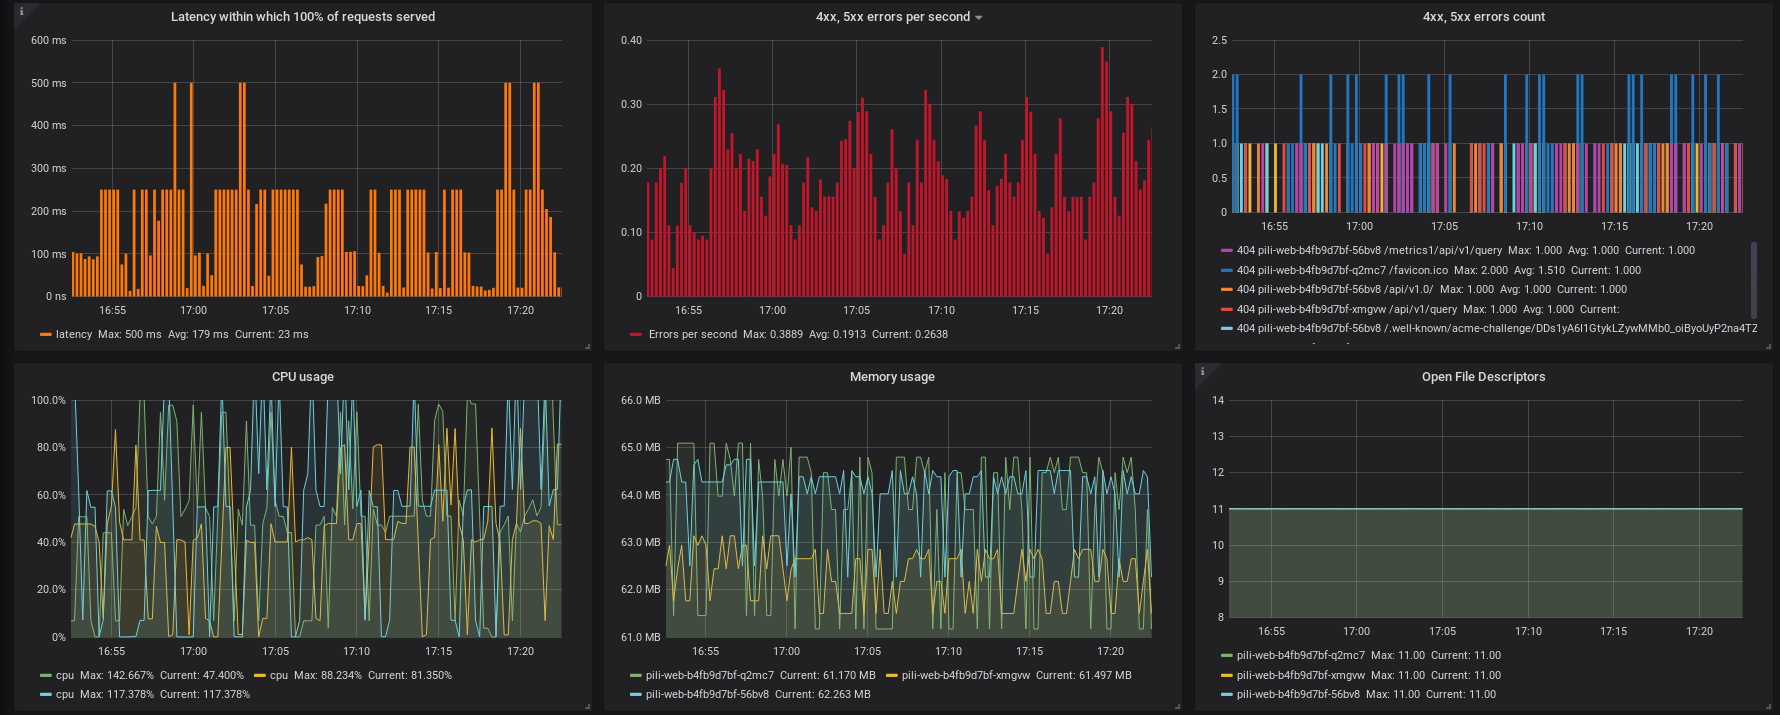
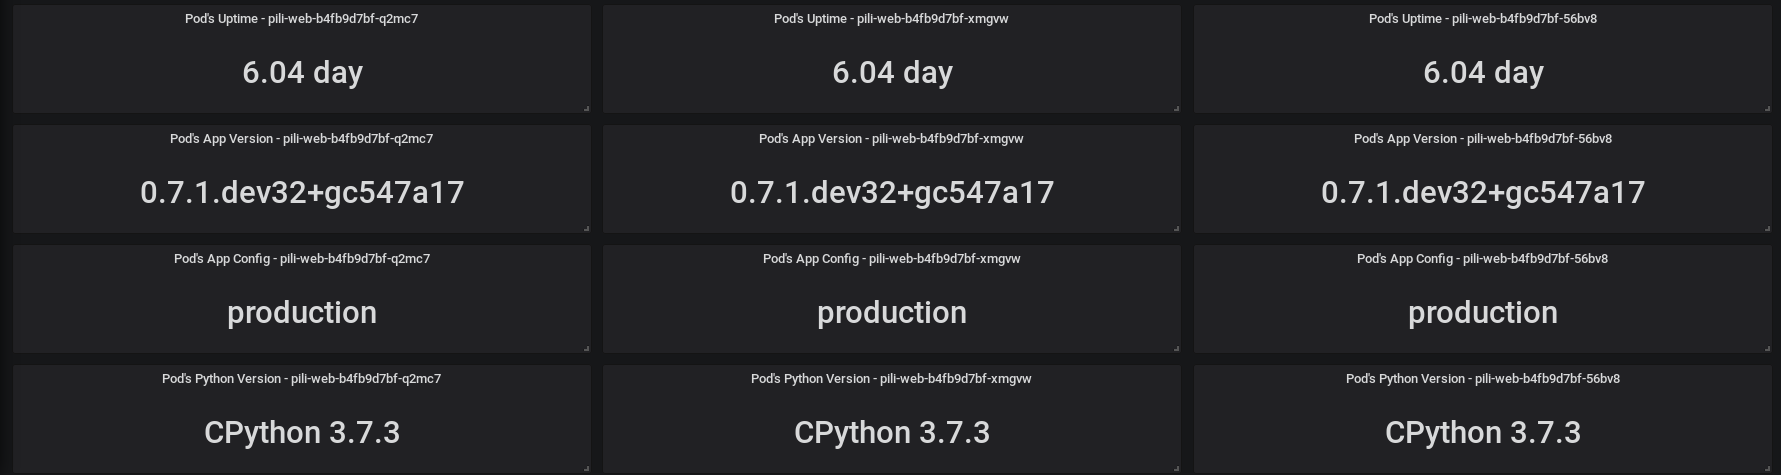
12 dasboard’s panels covers the following metrics:
- Requests per second per host, endpoint, HTTP method etc.
- Latency
- Percentiles (latency within which certain percent of requests served)
- Number of 4xx, 5xx errors per second
- Error count by endpoint
- CPU usage per host
- Memory usage per host
- Open file descriptors per host
- App’s uptime per host
- App’s version per host
- App’s deployment environment (e.g. development, staging, production) per host
- Python interpretor version per host
Dashboard also provides variables:
- Prometheus datasource
- Time interval
- Kubernetes pod name
- App’s endpoint
- HTTP method
- Percentile
- HTTP status code for errors
The variables allow to change some panels charts grouing, intervals, labels selection.
Usage is easy:
- Install flask_prometheus_metrics exporter to your Flask application
- Make Prometheus scraping your app’s /metrics endpoint
- Import flask-web-app.json at https://<your-grafana-domain>.tld/dashboard/import
If you do not deploy your app in Kubernetes you may need to tweak flask-web-app.json pod labels to meet your needs. Instead of pod you may use instance or hostname or other label name depending on how your Prometheus handle your app’s hostname.